The Gantt Chart timeframe is an important part of a project. It shows the working days of your project and the dependencies within the tasks of your project. The timeframe is located in the last column of the Gantt Chart.
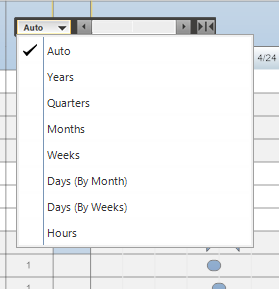
By default, the Gantt Chart timeframe is set to Auto. To change the view of your timeframe, simply hover over the timeframe column with your mouse until a pop-up bar appears:
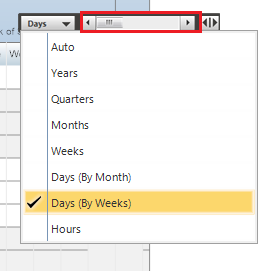
Select your desired timeframe view from the drop down menu located on the pop-up bar. Choose from Years, Quarters, Months, Weeks, Days (By Month), Days (By Weeks), or Hours.
If you select an option that would expand the width of your timeframe column (such as Days by Weeks for example), you'll see a Left-Right scroll bar appear within the pop-up bar.
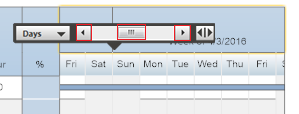
This scroll bar is used to scroll from left to right through your timeframe, while keeping your other columns locked. To utilize the scroll bar feature, hover over your timeframe column and click the Left arrow button to move the timeframe to the left, or click the Right arrow button to move the timeframe to the right.
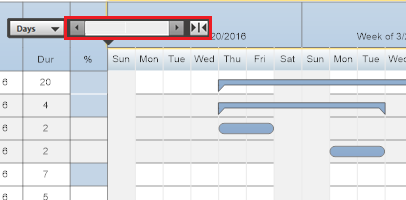
If you have already clicked on the button with two outward-facing arrows, you have expanded your timeframe column, which makes the Left and Right arrow buttons unusable, since your column is already completely expanded.
When your timeframe is completely expanded, the button that was previously two outward-facing arrows is now a button with two inward-facing arrows. This indicates that you can click it again, to return to the Left-Right scroll bar option.


Comments
0 comments
Article is closed for comments.